2019–2024: adaptation commitments rise, peak and retreat
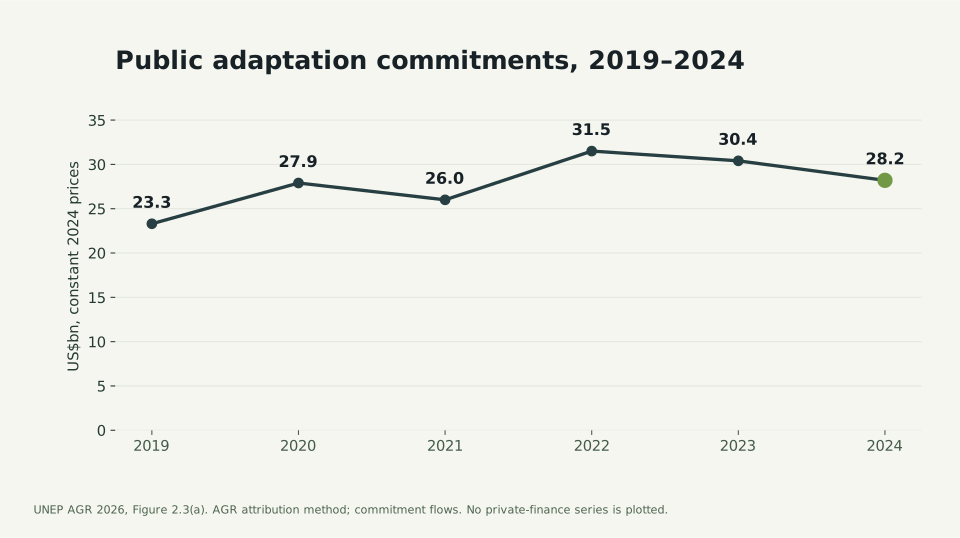
UNEP’s constant-price AGR series falls from $31.5 billion in 2022 to $28.2 billion in 2024. Our chart keeps one method and price base throughout.

One series throughout
The six annual observations are $23.3 billion, $27.9 billion, $26.0 billion, $31.5 billion, $30.4 billion and $28.2 billion for 2019–2024. They come from one UNEP figure using the AGR method and constant 2024 prices. The selected series attributes public adaptation commitments to developed countries; mobilised private finance is excluded.
Calculations from rounded amounts
The 2022 value is the peak in this series. Using the rounded published amounts, (28.2 / 31.5 − 1) × 100 gives a 10.5% decline by 2024. The last annual change, (28.2 / 30.4 − 1) × 100, is −7.2%. Six observations span five annual intervals; no missing year has been filled in.
Why another headline rises
UNEP’s press release also describes a $1 billion increase. That headline corresponds to another series rising from $30.7 billion to $31.7 billion. It uses the OECD method and current prices. Accounting treatment and price basis both differ, so inflation alone does not reconcile the directions. The release’s $28.2–31.7 billion range is not a statistical confidence interval.
The chart is a record of commitments, not verified money received or spent by recipients. It cannot establish protection delivered by projects. Nor should 2024 commitments be subtracted from estimated annual needs in 2035 to manufacture a same-year funding gap. Extending this chart requires the same definition, attribution and price base, with revisions recorded explicitly.
| Calculation | Result | Unit |
|---|---|---|
| 2024 change from 2022 peak | −10.5% | percent |
| 2024 year-on-year change | −7.2% | percent |
| 2019–2024 change | +21.0% | percent |
Sources and method
This is an original GlobalPulse research note or commentary. Its selection rules, judgments and limits are set out above. Read our editorial standards.