What supplied Apple’s extra $12 billion in quarterly sales?
iPhone contributed 71.3% of the net revenue increase. Our category bridge also retains the iPad and wearables declines that offset part of the gain.

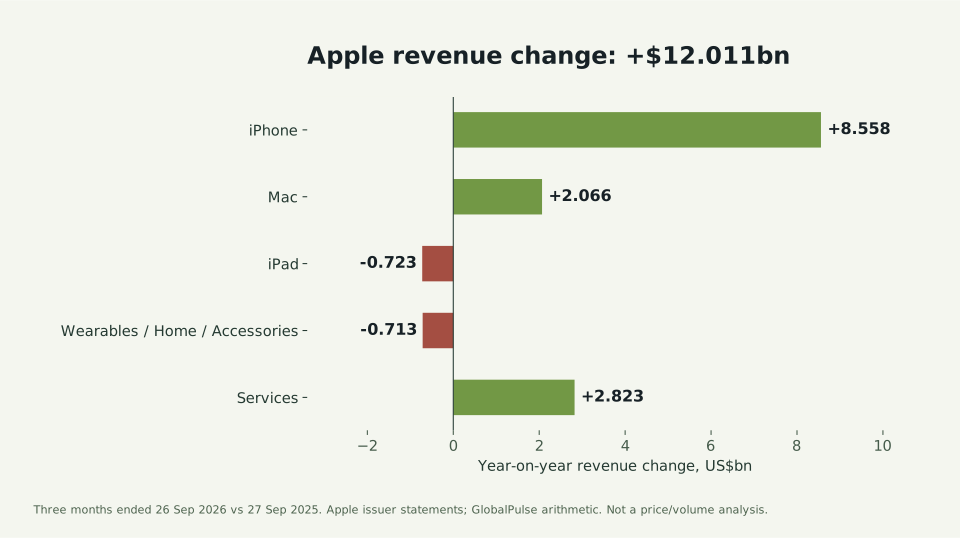
Reconcile the category changes
Apple’s category table reconciles to $12.011 billion of additional quarterly revenue. iPhone contributed $8.558 billion, Mac $2.066 billion and Services $2.823 billion. iPad reduced the increase by $723 million; Wearables, Home and Accessories reduced it by $713 million. Adding the five signed changes reproduces the reported total increase.
Contribution is a share of growth
For each category, we subtract the comparison quarter from the current quarter. Dividing iPhone’s $8.558 billion increase by the $12.011 billion net increase gives 71.3%. This is a share of the change, not a share of current sales. Positive contributions together exceed 100% because the declining categories offset part of their gain.
Use the quarterly columns
The columns cover three months ending September 26, 2026 and September 27, 2025. Total sales are $114.477 billion and $102.466 billion. Their difference divided by the earlier total gives 11.7% growth. Apple’s release rounds the result to 12%; the headline and the calculation are consistent.
These are issuer-reported, unaudited statements. The bridge decomposes a sales change and does not independently audit the figures. It also cannot separate prices from units, attribute growth to a particular launch or forecast another quarter. Its contribution is narrower and checkable: each component has a comparison period, a sign and a formula that returns to the reported total.
| Calculation | Result | Unit |
|---|---|---|
| Total current-quarter revenue | 114477 | US$ million |
| Total comparison-quarter revenue | 102466 | US$ million |
| Net revenue increase | 12011 | US$ million |
| Revenue growth | +11.7% | percent |
| iPhone share of net increase | 71.3% | percent of net revenue increase |
| iPad and wearables combined reduction | -1436 | US$ million |
| Bridge reconciliation | 12011 | US$ million; equals total revenue change |
Sources and method
Apple Q4 FY2026 consolidated financial statements ↗
This is an original GlobalPulse research note or commentary. Its selection rules, judgments and limits are set out above. Read our editorial standards.